
Monitoring and visualization are critical in today’s dynamic and data-driven world to ensure that applications and infrastructure run smoothly. Prometheus is a popular monitoring tool in the Kubernetes ecosystem, particularly when combined with Grafana for visualization. In this article, we will walk you through the steps of installing the Grafana Prometheus stack on an Amazon Elastic Kubernetes Service (EKS) cluster.
The Prometheus stack is a collection of tools used together for monitoring and observability in Kubernetes or other containerized environments. The primary components of the Prometheus stack typically include:
Prometheus : Prometheus is an open-source monitoring and alerting toolkit that was originally developed at SoundCloud. It prioritizes dependability, scalability, and simplicity. Prometheus collects metrics from monitored targets on a regular basis by scraping HTTP endpoints.
Grafana : Grafana is an open-source monitoring and observability platform that lets you query, visualize, and receive alerts on metrics and logs. It offers a powerful and versatile tool for creating dashboards to monitor various aspects of your infrastructure.
Alertmanager : Alertmanager is a Prometheus ecosystem component that manages alerts sent by the Prometheus server. It handles alert deduplication, grouping, and routing to the appropriate receivers.
Node Exporter : Node Exporter is a Prometheus exporter of system metrics like CPU, memory, disk usage, and network statistics. It operates as a daemonset on Kubernetes nodes, exposing metrics in Prometheus format.
Kube-state-metrics : Kube-state-metrics is a simple service that listens to the Kubernetes API server and generates metrics about the state of various Kubernetes objects (pods, nodes, deployments, etc.). Prometheus then scrapes these metrics for later monitoring.
The Prometheus stack combines these components to provide a comprehensive solution for monitoring Kubernetes clusters and the applications that run on them. It allows you to collect, store, visualize, and alert on a variety of metrics, giving you a better understanding of the health and performance of your infrastructure and apps.
Prerequisites
Before you begin the installation process, make sure you have the following prerequisites:
- An active Amazon EKS cluster
- Helm installed in your local environment
- kubectl configured to communicate with your EKS cluster
Installing Prometheus
The first step is to install Prometheus using Helm. Helm is a package manager for Kubernetes that simplifies the deployment and management of applications.
helm install prometheus prometheus-community/kube-prometheus-stackThis command will install the Prometheus operator along with other essential components like Alertmanager and node exporters.
You can access the prometheus using the kubernetes port-forwarding command in local.
kubectl port-forward svc/prometheus-kube-prometheus-prometheus 9090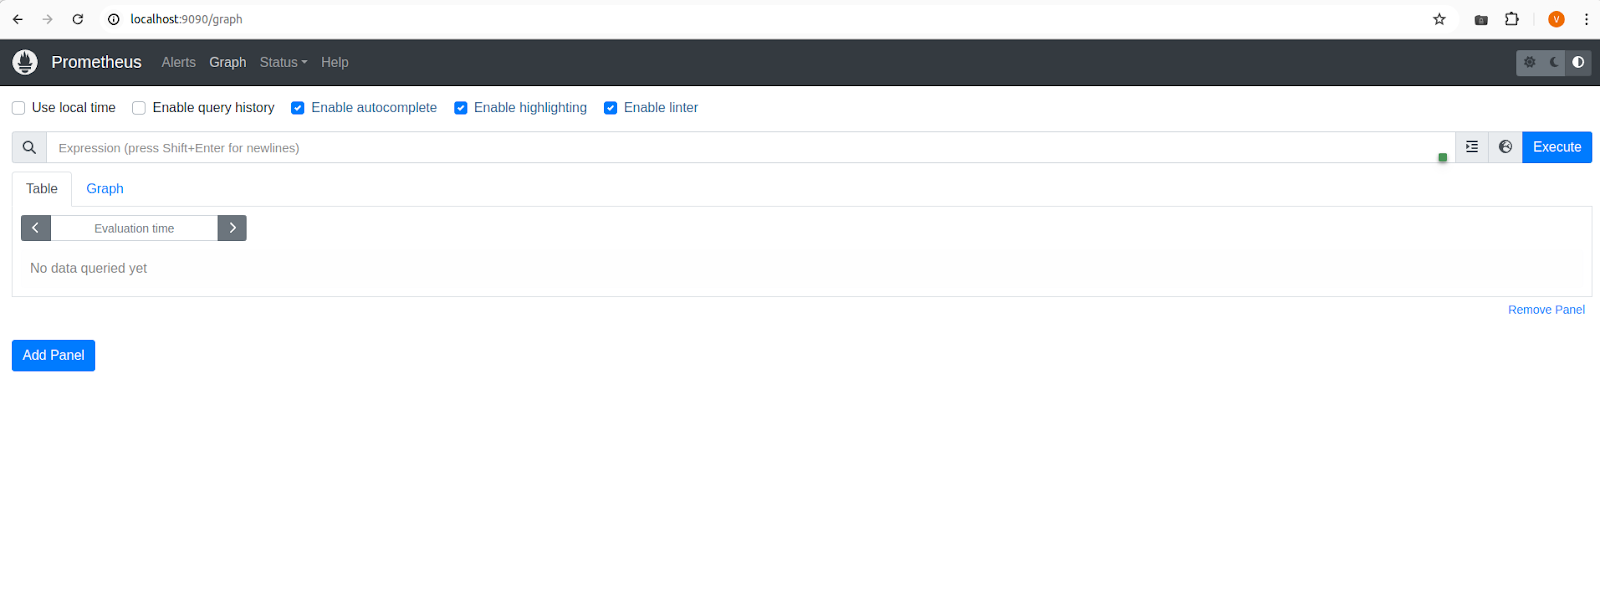
Retrieving Grafana Admin Password
Once the installation is complete, you need to retrieve the Grafana admin password to access the Grafana dashboard.
kubectl get secret prometheus-grafana -o jsonpath="{.data.admin-password}" | base64 --decode ; echoThis command fetches the Grafana admin password stored in a Kubernetes secret and decodes it. Make sure to note down the password for later use.
Accessing Grafana Dashboard
Expose the Grafana Kuberntes service and access the grafana from your local PC. You can also expose the service through a load balancer or ingress, depending on your needs.
kubectl port-forward svc/prometheus-grafana 80:80This command will expose your app in your local pc with port 80, Open http://localhost, and you should see the Grafana login page.
Use the following credentials to log in:
- Username: admin
- Password: [use the password retrieved in previous step]
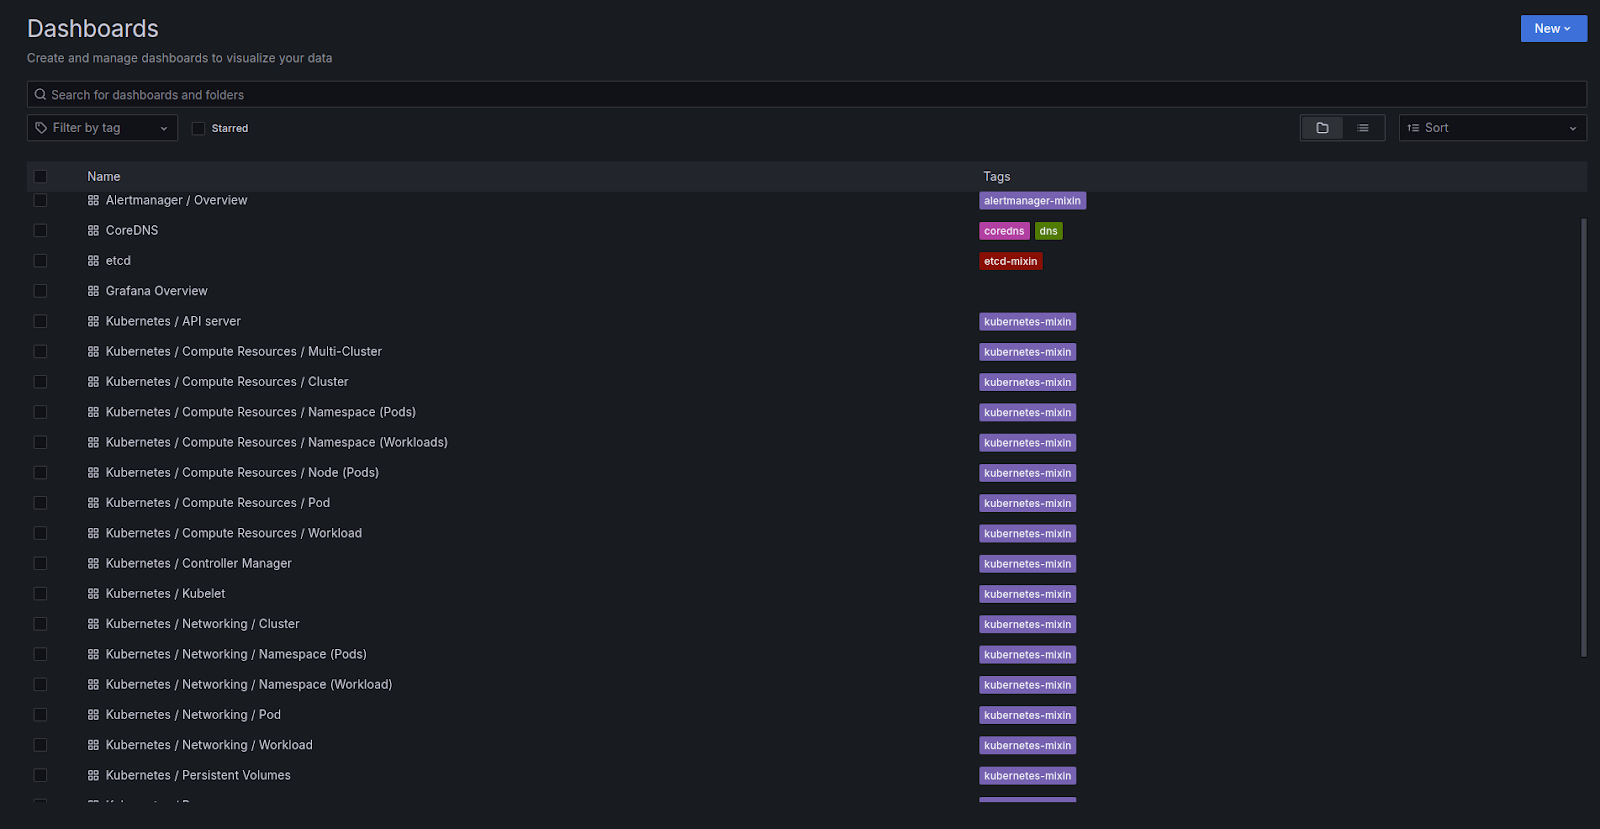
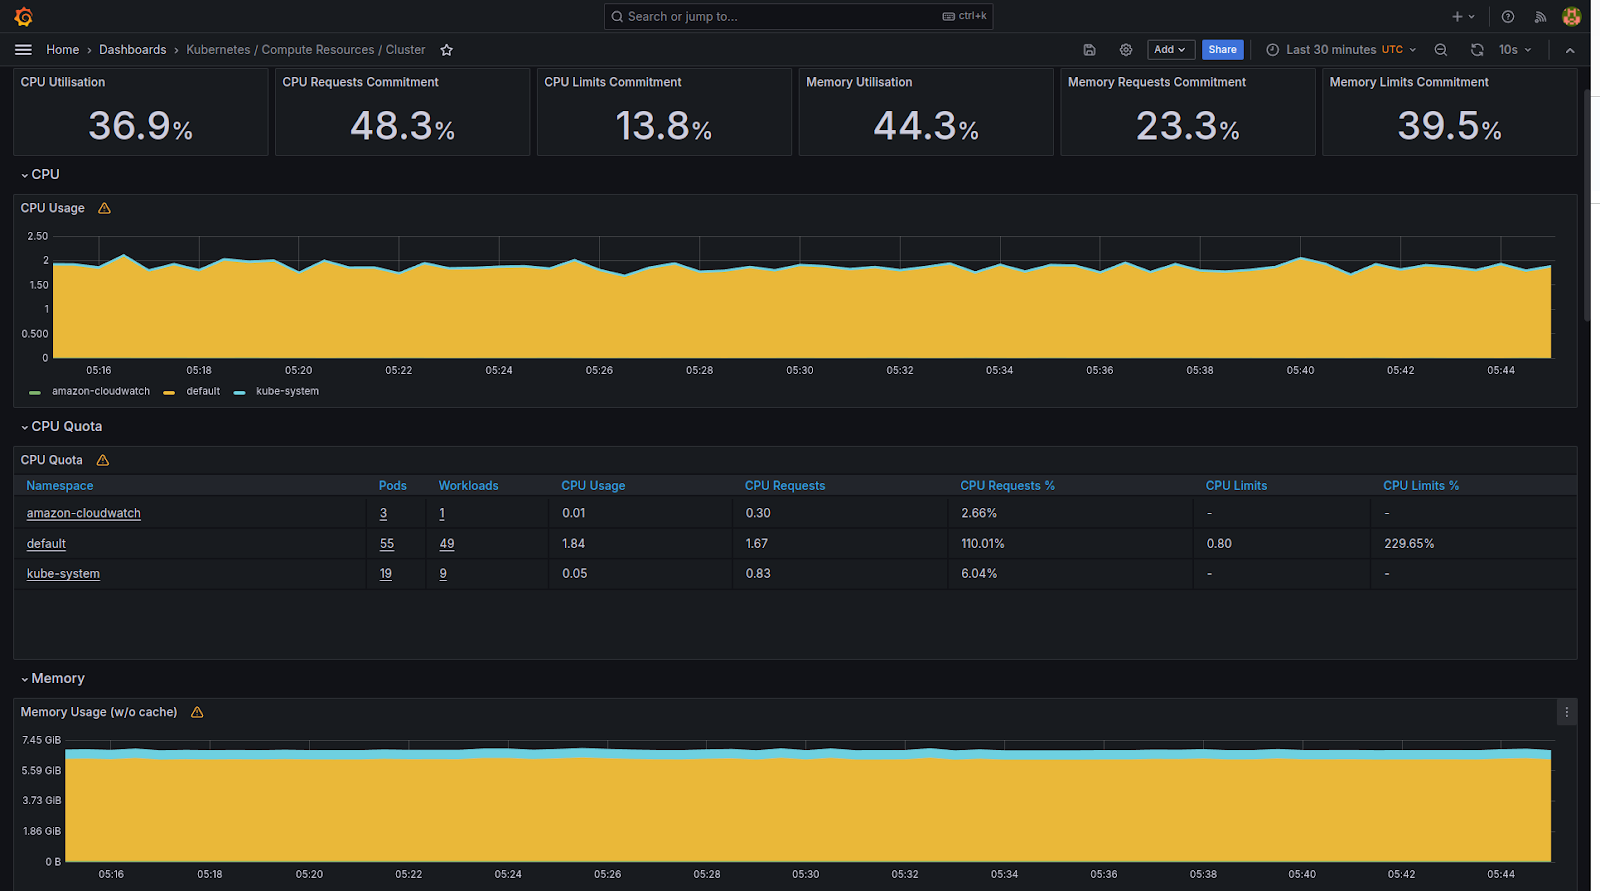
After logging in, it’s highly recommended to change the password for security purposes. By default, you will receive multiple dashboards for monitoring your EKS cluster. You can use this prometheus stack to monitor all resources in your EKS Kubernetes cluster.
Conclusion
Congratulations! You have successfully installed the Grafana Prometheus stack on your Amazon EKS cluster. With Prometheus collecting metrics and Grafana providing visualization capabilities, you now have powerful tools at your disposal for monitoring and troubleshooting your Kubernetes infrastructure.
Monitoring is a continuous process, and it’s essential to configure alerts and dashboards tailored to your specific use case. Explore Grafana’s extensive features and unleash the full potential of monitoring and observability in your Kubernetes environment.
It’s very easy to find out any matter on net as compared to textbooks, as I found this article at this
website.